
Methods
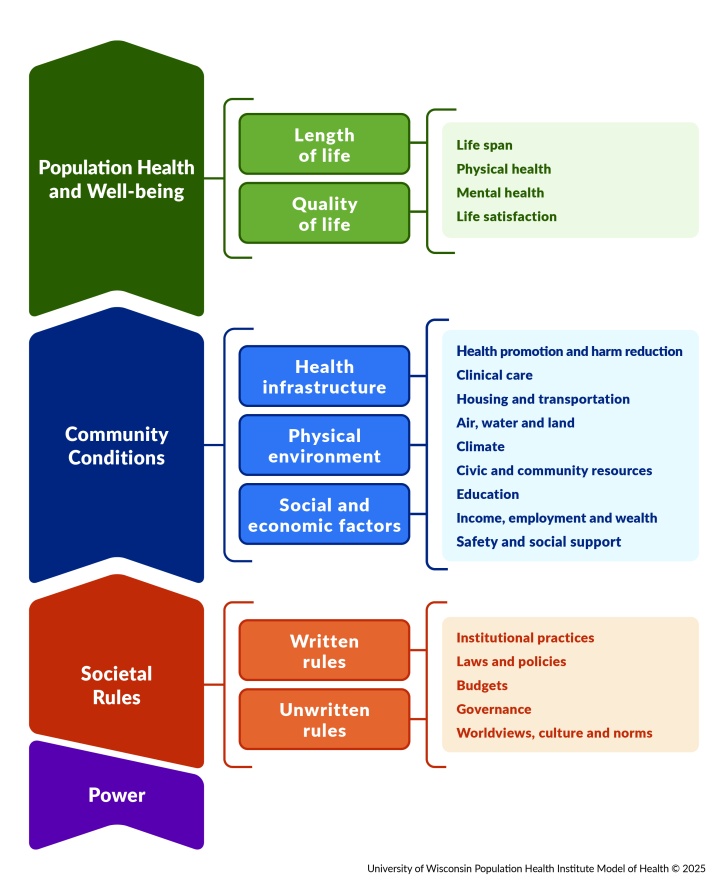
We provide measures of health for counties across the nation. The annual data release is compiled from a variety of national and state data sources. Our collection of over 80 measures of health is organized within topic areas according to the UW Population Health Institute Model of Health. Select measures are used to generate our Health Groups.
Population Health and Well-being includes:
- Length of Life
- Quality of Life
Community Conditions includes:
- Health Infrastructure
- Physical Environment
- Social and Economic Factors
To learn more about the evolution of our data assets and research on our methods, see our Working Paper and selected publications.
Explore the evolution of our model over time.
Detailed information about our current methodology is available in our downloadable Technical Document.
What is a county?
Any entity that has its own Federal Information Processing Standard (FIPS) county code is included in our data snapshots. The FIPS county code is a five-digit code in which the first 2 digits designate the state, and the last 3 digits designate county or county equivalent. Certain major cities, such as Baltimore and St. Louis, are considered county equivalents and have their own FIPS county code. Other cities, such as Chicago, do not have a FIPS county code.
Not all states use a county system. Some examples of county equivalents include Louisiana’s parishes, Connecticut’s planning regions and Alaska’s boroughs and census areas. These different systems are reflected across our materials when possible.
County definitions can change over time. A county may merge with another county, dissolve and be distributed into other counties, or undergo a name change.
Learn more about county changes in our Technical Document.
How are the Health Groups calculated?
Health Groups are constructed annually for both Community Conditions and Population Health and Well-being. Summary scores are calculated from individual Select measures based on the model of health. For each county with available data, we calculate two summary scores: a Population Health and Well-being summary and a Community Conditions summary.
To calculate Population Health and Well-being summary scores, the following weights are used:
- Length of Life (50%)
- Quality of Life (50%)
To calculate Community Condition summary scores, the following weights are used:
- Health Infrastructure (25%)
- Physical Environment (25%)
- Social and Economic Factors (50%)
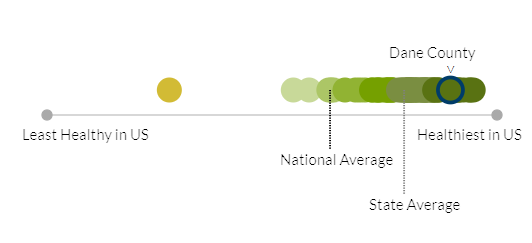
After summary scores are calculated, they are assigned to one of ten groups nationally using a data-informed grouping method, which groups counties based on similarity and meaningful gaps in the data. Summary scores for Population Health and Well-being and Community Conditions are separately sorted into ten unequally-sized groups based on the data, ranging from the least healthy to healthiest counties across the nation. A county in the first group is among the healthiest in the nation, while a county in the tenth group is among the least healthy in the nation. States may or may not have counties that fall within each of the ten groups across the range of health nationally.
Beginning in 2024, Health Groups are displayed in the county health snapshot. These graphics provide an indication of how the county fares relative to other counties in the state and the nation.
It is important to note that these groupings themselves do not necessarily represent statistically significant differences from county to county but rather support more data-informed comparisons and a focus on meaningful similarities that can better support action.
Addressing Missing Data in Health Group Calculations
If a county has sufficient data to be assigned a Health Group, but is missing data for a given select measure, we assign the average of state Z-scores from counties in that state that have data for that measure value to calculate the county’s Health Group.
Learn more about Health Group methods in our Technical Document.
How are measures selected?
We have selected five measures to include in the summary score for Population Health and Well-being and 29 measures to include in the summary score for Community Conditions. Beyond the Select measures we also provide additional measures and demographic measures, to offer a broader picture of health and well-being in a county. In our interactive model, these additional measures are noted with an asterisk (*).
View a full list of measures for our most recent annual data release
There are five main considerations in choosing select measures:
- Alignment with CHR&R program goals
- Connection of the measure to health and equity
- Assessment of data sources and their methodology
- Feasibility of quantitative and qualitative analysis for evaluation and production
- Ability to meaningfully communicate and apply the measure to improve health and equity
Learn more about specific criteria for selecting new measures in our Technical Document.
How do we address data reliability and comparability?
We draw upon the most reliable and valid data available to compile measures of opportunity for health and how long and well people live in a county.
Data Reliability
Data must be reliable – accurate and stable over time – to inform confident decisions and conclusions. Data reliability is one of our primary concerns when estimating values for relatively small areas like counties. We make every effort to provide the most reliable data available, and users should be aware that reliability can vary by place and by measure.
For measures of rare events in small populations, data values can change a lot between years. We combine multiple years of data in our measures where necessary to increase the stability of the measure.
We provide error margins for many measures to estimate the amount of uncertainty in the data value. Larger error margins suggest lower reliability for the associated data value. The use of multiple Select measures together to inform the summary scores used to determine Health Groups can more reliability capture an underlying concept than a single measure alone.
Statistical Uncertainty and Error Margins
Where possible, we provide the margins of error (95% confidence intervals) for our measure values. In many cases, the values of specific measures are not statistically different between counties.
Error margins represent a range within which the true population experience may differ from our measure value. However, we are 95% certain that the true population experience falls within that range. When the error margin ranges for a given measure overlap between two places, we can be less confident that the true population experiences (in those places) are different from each other.
Age-adjustment
Age-adjustment is a useful strategy to increase the comparability of measure values between counties that have different age structures, or within county comparisons over time if the county age structure changes This is especially important for measures of factors related to age. We adjust county values for factors known to differ by age groups (or change with aging) so that all counties reflect a standard age distribution.
Example:
The measure of Adult Smoking is related to the age structure of the county. Research has found cigarette smoking to be highest among those ages 25-64. A county with a relatively large population of people in the 25-64 age group would be more likely to have a higher percentage of adults reporting smoking behavior because more adults in the high-risk age group live in that county.
However, age-adjustment can mask the true burden of a health need in a county – especially counties with many residents in higher-risk age groups. Measure data tables are available to communicate the absolute number of events occurring for many measures where the county value has been age-adjusted. We follow best practice to determine which measures are age-adjusted.
Additional methodological information is available in our Technical Document.