2023 County Health Rankings National Findings Report
Cultivating Civic Infrastructure and Participation for Healthier Communities
Introduction
County Health Rankings & Roadmaps (CHR&R) brings actionable data, evidence, guidance and stories to support community-led efforts to grow community power and improve health equity. The University of Wisconsin Population Health Institute (UWPHI) created CHR&R for communities across the nation, with funding from the Robert Wood Johnson Foundation.
This year, we focus on the connection between civic health and thriving people and places. Civic health reflects the opportunities people have to participate in their communities. It starts in our local communities and is the cornerstone of our democracy, representing promise, opportunity, belonging and shared responsibility.
We look at two elements of civic health:
-
CIVIC INFRASTRUCTURE, which includes the spaces such as schools, parks and libraries that help us stay connected and policies and practices that foster belonging, making civic participation possible.
- CIVIC PARTICIPATION, which includes the ways people engage in community life to improve conditions and shape the community’s future, whether through political activities such as voting and advocacy, or community activities such as volunteering and mentoring.
Our civic health must be nurtured. Intentional investments in civic spaces that foster inclusive participation can have a positive impact on health equity. On the other hand, neglect or deliberate exclusion is detrimental to civic health and our opportunity to thrive. Our civic health depends on the decisions we make—whether we are an elected official or a local volunteer—to cultivate community conditions where everyone is welcome, lives with dignity, and thrives.
History shows that when previously disenfranchised groups built power and expressed their will through voting and advocacy, the policies that followed benefited the health and well-being of all. For example, after women won the right to vote in 1920, infant mortality rates dropped dramatically when lawmakers passed a law that set up maternal and child health units in every state health department, expanded birth and death data collection and supported home-visiting initiatives. The Civil Rights Act, which included hospital desegregation, is associated with health improvement. From 1965 through 1971, infant mortality rates dropped significantly and the gap between Black and white infant mortality narrowed. This followed the passage of the Voting Rights Act in 1965, which fundamentally shifted electoral power in the U.S. and ushered in a new era of government responsiveness to Black voter participation and marginalized populations.
We will make progress toward health equity when all people can be heard and have meaningful involvement in decision-making processes. To do this, we must repair harmful policies and practices aimed at exclusion. There are multiple examples of laws and policies—some that started with the birth of the nation and whose effects are still felt today—that underlie current barriers to health. The U.S. census, started in 1790, excluded American Indians until 1890. Literacy tests and poll taxes during the Jim Crow era intentionally prevented Black Americans from voting. Current policy proposals that levy fines, impose prison sentences or force protestors to pay for policing costs all deter people from the right to peaceably assemble. Discriminatory policies and practices do not reflect the aspirational values of our democracy. We can claim our democracy for the common good.
Civic Infrastructure: Making Spaces for Connection

Civic infrastructure provides us with spaces to meet, make our voices heard, engage in cultural activities, enjoy nature and feel like we belong. These civic spaces support our ability to do things together—whether it’s volunteering at the senior center or attending a community advisory council meeting. Civic spaces are created and maintained with intention—sometimes by governing bodies and sometimes by neighbors working together. They provide a foundation for civic action and local solutions.
Vibrant civic infrastructure is not a reality across all U.S. communities, nor has it ever been. To this day, many groups of people in our communities—but especially people who are Black, American Indian, immigrants, women, LGBTQ+ and have low-incomes—experience the impacts of a history of disinvestment in civic infrastructure and systematic exclusionary policies and practices. Examples of exclusion include “closed door” decision-making on resource allocation, laws restricting voter eligibility or registration, residential segregation and digital redlining.
We all lose when we disinvest in civic infrastructure that can serve everyone. For example, many communities drained their public pools when racial integration was mandated, denying all people in the community a place to gather and connect in healthy ways.
Systematic exclusionary policies and practices create structural barriers to civic health. They deny many groups of people the ability to safely participate in civic life. This restricts access to opportunities for good health and makes it harder for us to work together to make our communities places where everyone thrives.
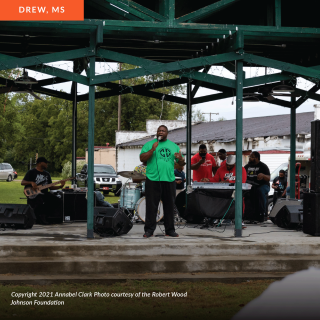
Drew, Mississippi, is a small town in the Mississippi Delta that looks to people power for its sense of community. Volunteerism fuels the rural community forward after decades of disinvestment and systemic racism left limited opportunity in its wake. Organizations are bringing together residents and local leaders to create a town that reflects a vibrant and socially connected community that works together to create solutions. Since 2016, We2Gether Creating Change has been bringing together partners, such as Drew United for Progress, the City of Drew and Hope Enterprise Corporation—all under the umbrella of the Drew Collaborative—to bring a playground to the town to give families and children a safe place to gather. They also built a pavilion in the town center where concerts, “Drew Day” and Juneteenth festivities occur. Plans to repurpose a city-owned armory into community gardens and a high-speed internet hub for residents to take online classes are on the horizon. Drew is establishing bonds and building a more connected and healthy community by reimagining and revitalizing the spaces where neighbors can engage with one another.
Key Findings:
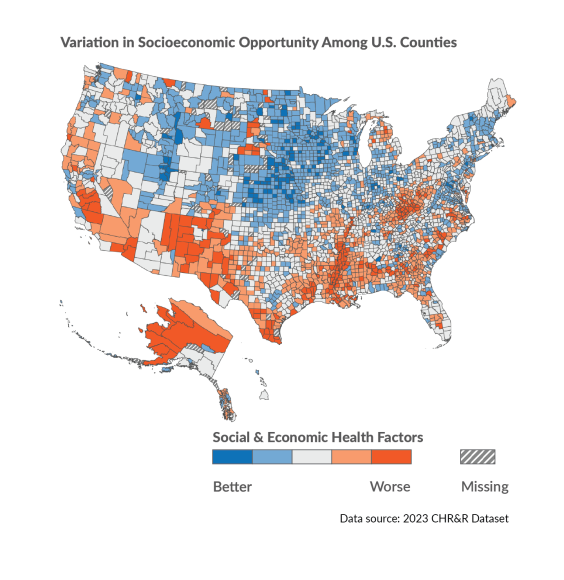

Civic infrastructure and the opportunity to live long and well varies across U.S. counties. Civic infrastructure varies across U.S. counties and regions. Counties in the Northeast, Midwest and West have more available and resourced civic infrastructure (including access to civic spaces and information such as broadband, libraries, newspapers, social associations, parks and schools). These counties often also have more social and economic opportunity.
- Where types of long-standing discrimination and disinvestment have occurred through policies and practices—such as racial segregation through redlining, legal actions to terminate tribal culture and land rights and disinvestment in rural economies—counties have fewer social and economic opportunities (maps to the right). This includes opportunities for education, employment, income and family and social support. These counties consistently fall among the least healthy in measures of length and quality of life.
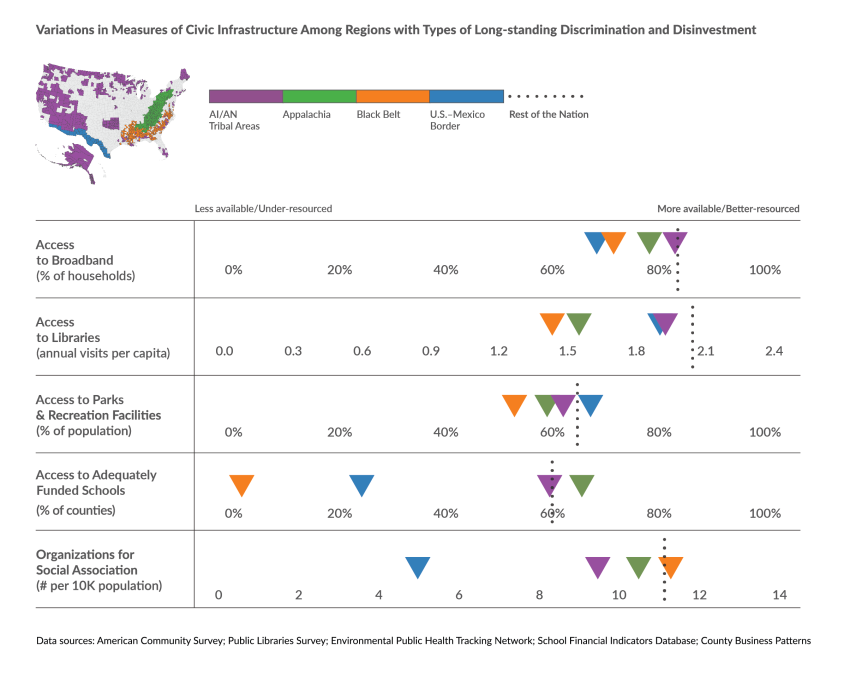
- Counties in regions such as the U.S.-Mexico Border, Black Belt Region, American Indian/Alaska Native (AI/AN) tribal areas and their surrounding counties, and Appalachia experiencing these forms of structural racism and disinvestment are often more rural and have a greater percentage of the population of color than the U.S., on average. These counties experience higher rates of children living in poverty, people without health insurance, lower household incomes and greater income inequality and lower rates of high school completion than the rest of the nation’s counties, on average.
- Among counties outside of these regions, approximately 83% of households have access to broadband internet and 66% of the population lives near a park or recreation facility. Most counties have adequate public school funding to support student achievement of national average test scores. Library visits typically occur twice per capita more often, annually (see figure below).
- Compared to the rest of the nation’s counties, counties in disinvested regions tend to have less available and under-resourced civic infrastructure. For instance, only 4% of counties in the Black Belt Region have adequate school funding and experience deficits of $8,000 more per student annually than the rest of the nation’s counties, on average. Counties in the U.S.-Mexico Border Region have less than half as many social associations and more than 15% less household access to broadband internet.
See Glossary of Terms & Technical notes for definitions of types of long-standing discrimination and disinvestment and regions and county categories.
Taking Action:
We have the power to create places where all people can participate. Strategies to improve civic infrastructure that serves everyone include:
|
Image

|
Civic Spaces to Connect, Learn & Collectively Act
|
|
Image

|
Governance & Resources
|
|
Image

|
Social Networks & Shared Culture
|
Civic Participation: Shaping Our Communities
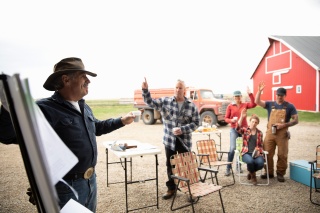
Civic infrastructure can encourage civic participation and help us stay connected and healthy. Civic participation includes the ways people participate in community life to improve conditions and shape the community’s future. Participation in civic life takes many forms, including:
- Community-building activities such as volunteering, joining neighborhood groups, mentoring, participating in the census, donating to causes, helping neighbors and faith-based service.
- Political and electoral participation through voting, attending rallies, engaging in boycotts, community organizing, running for office, supporting candidates and other activities intended to drive policies and systems change.
Voting, volunteering and responding to the census are important examples of civic participation.
|
Image

|
Voting is a form of civic participation that symbolizes a commitment to democratic processes. Voting can influence policies that create opportunities for health, including safe spaces to live and work or funding for public health initiatives. Voter participation is tied to better self-reported health. |
|
Image

|
Volunteering has physical and mental health benefits. Examples include less anxiety and depression, longer lifespan and increases social connection and sense of belonging in a community. According to recent census data, just over 23% of people across the U.S. volunteered with formal organizations and 51% volunteered informally by doing favors for neighbors like house sitting, watching each other’s children, lending tools and running errands. |
|
Image

|
Participation in the U.S. census determines the distribution of resources and representation, such as the annual distribution of $1.5 trillion in federal funds for essential services including health care, food assistance and education. The census also determines states’ representation in Congress, how representation is structured through redistricting, and how state and local governments draw electoral districts. People can participate in the census by self-responding via mail, internet or phone. The Census Bureau employs additional follow-up methods with the goal of counting everyone. Self-response represents a level of census participation that can be influenced by local community actions such as educational campaigns to share important census dates and processes and increase local awareness of the importance of the census. |

Cornelius, an Oregon suburb located just under 25 miles outside Portland, set out to engage its residents to build a more connected and thriving community. Over a decade ago, as their Latino population grew, the city partnered with a community-based organization, Centro Cultural, to hold Spanish-language town halls where government officials and residents discovered shared interests and priorities and local organizations provided resources. On average, 50-100 people attended each town hall and they became a space for honest discussions that increased trust and transparency. To promote greater inclusion, the city began publishing printed and online materials in English and Spanish and actively recruited members of the Latino community to join commissions and boards. Today, Latinos make up nearly half of the city’s board and commission membership.
To make sure the downtown area reflected what people wanted, the city launched a community-wide outreach effort that included surveys, stakeholder interviews, bilingual teams at community events and more. The city’s Youth Advisory Council led an evening meeting to get more people who were busy during the day to attend. Almost 1,800 people responded via survey and poster boards. Their responses showed that residents wanted the new downtown to enhance existing amenities, boost public safety and provide more community gathering places.
Early plans to rebuild downtown included a cultural center and library, but a bond to fund the project failed. A group of dedicated volunteers kept the idea alive and renewed public support through a privately funded feasibility study. To optimize space and meet community needs, they found a partner to occupy the floors above the library—a nonprofit, low-income housing developer. The effort, unanimously approved by the city council, led to Cornelius Place, a mixed-used project in the city center easily accessible by bus with a bilingual library staff and 45 units of affordable senior housing on the remaining floors. Residents of the building are often trained volunteers at the library and each student at the nearby Cornelius Elementary School gets a library card for daily use. Built with civic activity in mind, the library has space for community meetings and lectures and has a vision for a student maker-space in its future. Its u-shape design was intentionally created for outdoor movies and concerts by night and farmer’s markets activities during the day in its plaza.
Cornelius’s power is in its residents — the individuals who stroll its streets, visit the city’s many public spaces and choose to call it home. By investing in its infrastructure, the city has created a dynamic and connected community that is welcoming to all.
Key Findings:
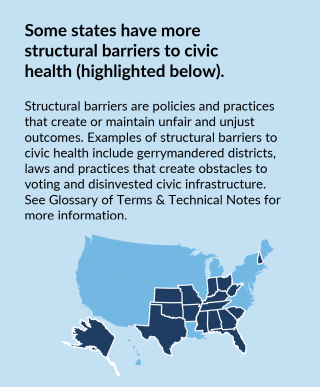
Areas with well-resourced civic infrastructure have more civic participation. Both are tied to how well and how long we live.
- Counties with more available and better-resourced civic infrastructure have higher rates of U.S. census participation and voter turnout than counties with under-resourced or restrictive civic infrastructure.
- Across U.S. counties, an average of 60% of households participated in the U.S. census by mail, internet or phone. Census participation was highest in the Midwest and Northeast, and lowest in the West and the South. Census participation was highest in suburban and large metro areas and lowest in rural and small metro areas (map, below left).
- Approximately 66% of the citizen voting age population among U.S. counties successfully cast a vote in the 2020 presidential election. Voter turnout was highest in the West, Northeast and Midwest, and lowest in the South. Voter turnout was highest in suburban and large metro areas and lowest in rural and small metro areas (map, below right).
See Glossary of Terms & Technical Notes for definitions of structural barriers to civic health and regions and county categories.
- Healthier counties (i.e., those in the top 10% for Health Outcomes) have more available and better-resourced civic infrastructure, including access to information via broadband internet, libraries and local newspapers, and access to civic spaces, including adequately funded schools, parks and social associations (see figure below). For instance, the average county among the healthiest 10% has almost twice as much access to parks and recreation facilities, and 24% more household access to broadband internet than the least healthy counties. The vast majority of healthier counties (88%) have adequate school funding to support student achievement of national average test scores and schools nearly have $9,000 more per student, annually, on average.
- Healthier counties also have higher rates of voter turnout (more than 30% higher) and census participation (more then 40% higher) than among the least healthy counties.
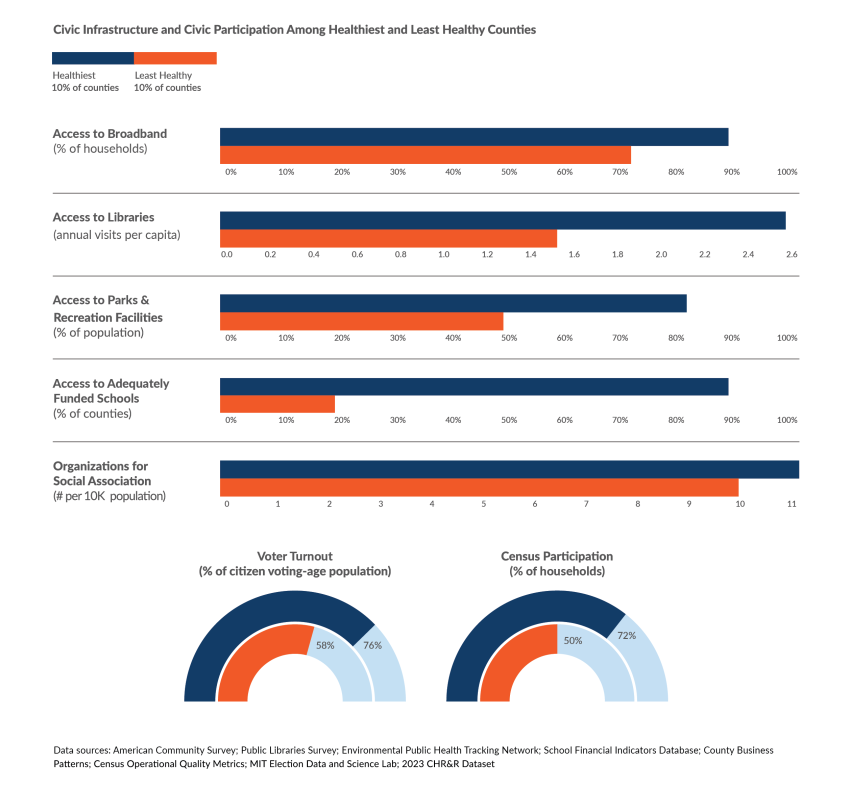
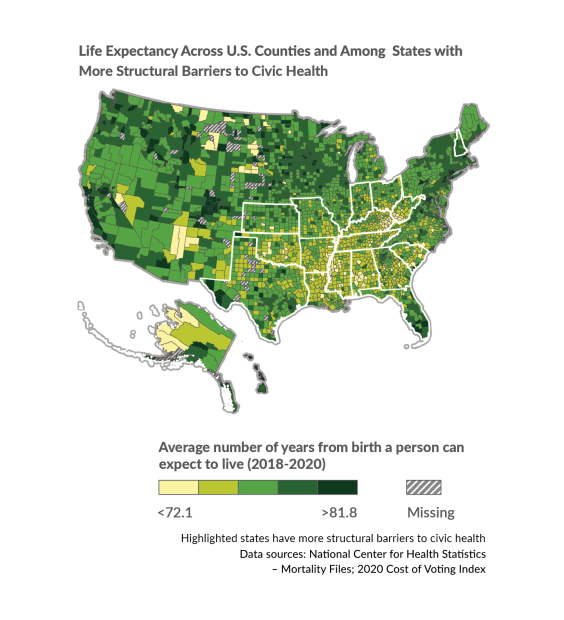
A familiar geographic pattern of structural barriers to civic health overlaps with signs of diminished civic participation, fewer social and economic opportunities and worse health outcomes.
- Structural barriers to civic health include more heavily gerrymandered districts, laws and practices that create obstacles to voting (referred to as higher costs of voting) and disinvested civic infrastructure. More structural barriers largely overlap with regions of our country, particularly in the Southern states, with specific histories of structural racism and disinvestment, described previously (see highlighted borders in map at right and above).
- In states with more structural barriers to civic health (see highlighted borders), rates of voter turnout, census participation and volunteering are lowest (see maps above). Civic infrastructure, such as parks, libraries and school funding is less available and under-resourced among counties in these states.
- At 75.4, life expectancy from birth in these counties is, on average, more than three years shorter than in counties experiencing fewer structural barriers (78.5 years) (map at right).
Taking Action:
All people should have the opportunity to meaningfully shape the decisions that affect their communities. Our communities are stronger when everyone can give input and participate. Strategies to foster civic participation include:
|
Image

|
Civic Spaces to Connect, Learn & Collectively Act
|
|
Image

|
Governance & Resources
|
|
Image

|
Social Networks & Shared Culture
|
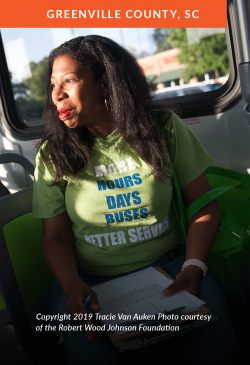
Located at the base of the Blue Ridge Mountains, Greenville County is home to South Carolina’s most populated city, Greenville, which has earned awards for being a great place to live and visit. Yet the community’s progress and prosperity are not shared by all, particularly people living in the county’s historically Black neighborhoods. To change this, residents are working to create an inclusive environment by fostering neighbor-to-neighbor connections and educating everyone on how local government works so that it can work for everyone. Improving Greenlink, the county public transportation system, is a key example. Local advocates called Greenshirts were instrumental in collecting input and signatures from bus riders and lifting up concerns with local leaders about the need for enhanced services. Their work led to expanded hours, new routes to underserved areas, electronic payments cards instead of cash payments with no change and an $11 million grant for a new maintenance facility. Building on the success of the Greenshirts’ advocacy, other organizations are working to build community power and voice including: Greenville Homeless Alliance’s Citizen Training Academy, LiveWell Greenville’s Community Residence Boards and Greater Good Greenville’s Simple Civics podcast. These resident-led efforts are removing structural barriers to civic engagement to ensure the voices of all people, especially those who have been excluded from decision-making, are heard and valued.
About County Health Rankings & Roadmaps
County Health Rankings & Roadmaps (CHR&R), a program of the University of Wisconsin Population Health Institute, works to improve health outcomes for all and close health gaps between those with the most and fewest opportunities for good health. This work is rooted in a long-term vision that all people and places have what they need to thrive. CHR&R is committed to creating resources and tools that support community-led efforts to accurately diagnose core problems, understand and account for historical context and implement evidence-informed solutions.
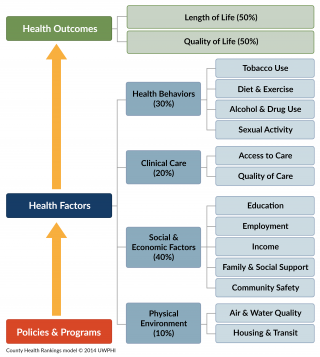
A wide range of factors influence how long and how well we live, including: opportunities for education, income and wealth generation, safe, secure and affordable housing, and the right to shape policies and practices that impact our everyday lives (see model of health, right). For some people, the essential elements for a healthy life are readily available; for others, the opportunities are significantly limited due to power imbalances in decision-making and resource allocation.
CHR&R believes that differences in opportunity result from our collective decision-making. We can build the will to implement policies and programs that positively influence how resources are allocated, how services are provided, how groups are valued and, ultimately, how and whether we thrive. CHR&R seeks to foster social solidarity and help build community power for health equity.
Glossary of Terms & Technical Notes
Glossary of Terms
Civic health: The degree to which citizens participate in their communities, from local and state governance to interactions with friends or family. Civic health relates to the overall well-being of neighborhoods, communities, states and the nation (National Conference on Citizenship).
Civic infrastructure: Places, policies, programs and practices that undergird strong communities and foster civic participation (Patrick and Brady 2015).
Civic life: The public life of a citizen concerned with the affairs of the community and nation (Center for Civic Education).
Civic participation: The ways people participate in the life of a community in order to improve conditions and/or shape the community’s future (Adler and Goggin 2016).
Community power: The ability of communities most impacted by structural inequity to develop, sustain and grow an organized group of people who act together through democratic structures to set agendas, shift public discourse, influence who makes decisions and cultivate ongoing relationships of mutual accountability with decision-makers that change systems and advance health equity (Lead Local).
Democracy: A form of government where citizens elect leaders to govern on their behalf.
Digital redlining: The modern equivalent of this historical form of redlining creates and maintains technological policies, practices and investment decisions that enforce class boundaries and discriminate against specific populations. For example, this entails under-resourced broadband infrastructure in low-income and rural areas and neighborhoods, often with high proportions of people of color (Gilliard and Culik 2016).
Gerrymandering: The process of drawing voting district boundaries with the intention of influencing who gets elected, favoring some groups and disenfranchising others (Brennan Center 2021).
Governance: The process of aligning actors and getting to agreement. Governance structures determine how power is distributed and exercised in decision-making that shapes places as well as access to resources and opportunities. Participation, partnerships and community empowerment are elements of governance structures that promote health equity (ChangeLab Solutions 2023).
Health equity: Assurance of the conditions for optimal health for all people. Achieving health equity requires valuing all individuals and populations equally, recognizing and rectifying historical injustice, and providing resources according to need (Jones 2014).
Social solidarity: Emphasizes the interdependence between individuals in a society, which allows individuals to feel that they can enhance the lives of others. It is a core principle of collective action and is founded on shared values and beliefs among different groups in society (Douwes et al. 2018).
Redlining: The Federal Housing Administration’s policies from the 1930s that entrenched racial residential segregation. Redlining denied Black people and some other ethnic groups access to government-insured mortgages and labeled homes in neighborhoods where Black people and some other ethnic groups lived as uninsurable, thereby guaranteeing that property values in those neighborhoods would be less than those in non-immigrant white neighborhoods (Mapping Inequality, n.d.).
Structural barriers: Obstacles that collectively affect a group disproportionately and perpetuate or maintain stark disparities in outcomes (AHA Institute for Diversity and Health Equity, n.d.). See technical notes below for more information on how structural barriers are measured in this report.
Structural racism: Refers to the totality of ways in which societies foster racial discrimination through mutually reinforcing systems of housing, education, employment, earnings, benefits, credit, media, health care and criminal justice. These patterns and practices in turn reinforce discriminatory beliefs, values, and distribution of resources (Bailey et al. 2017).
Technical Notes
Definitions for Racial and Ethnic Categories:
We recognize that race and ethnicity are social categories. Society may identify individuals based on their physical appearance or perceived cultural ancestry, as a way of characterizing individuals’ value. These categories are not based on biology or genetics. A strong and growing body of empirical research provides support for the fact that genetic factors are not responsible for racial differences in health factors and very rarely for health outcomes. We are bound by data collection and categorization of race and ethnicity to the U.S. Census Bureau definitions, in adherence with the 1997 Office of Management and Budget standards. Our analyses also do not capture those reporting more than one race, of “some other race” or who do not report their race. This categorization can mask variation within racial and ethnic groups and can hide historical context that underlies health differences.
Definitions for Regions and County Categories:
The Appalachian Region is defined as the 423 counties across 13 states from southern New York to northern Mississippi that span the Appalachian mountain range and are served by the Appalachian Regional Commission.
The Black Belt Region is defined as the 285 counties in the Southern region of the U.S. that have populations where greater than or equal to 30% of their residents identify as non-Hispanic Black or African American Alone, according to the 2020 Decennial Census.
The U.S.-Mexico Border Region is defined as the aggregate of 44 counties within 100 kilometers (or 62.5 miles) of the international boundary, stretching 2,000 miles from the southern tip of Texas to California.
AI/AN tribal areas and their surrounding counties is defined as counties where any part of the county includes an American Indian or Alaska Native tribal area as delineated by the U.S. Census Bureau.
We define rural and urban classifications as:
- Rural - non-metropolitan counties with less than 50,000 people
- Smaller Metro - counties within a metropolitan statistical area, or MSA, with between 50,000 and one million people
- Large Suburban Metro - non-central fringe counties within an MSA with more than one million people
- Large Urban Metro - central urban core counties within an MSA with more than one million people
We define the healthiest and least healthy counties as those that scored among the 10th (least healthy) and 90th (healthiest) percentile counties, nationwide, for the 2023 Health Outcomes z-score.
Data Sources and Measures
- Structural Barriers: Data sources for structural barriers include the 2020 Cost of Voting Index (COVI) and the State Democracy Index. The 2020 COVI, which measures the relative difficulty of voting in each state, was created from nine issue areas, including: registration deadlines, registration restrictions, registration drive restrictions, pre-registration laws for 16 and 17 year olds, automatic voter registration, voting inconvenience, voter ID laws, poll hours and early voting. The State Democracy Index, which measures the quality of democratic institutions in states, uses 51 democracy indicators, such as measures of gerrymandering, electoral policies that affect the eligibility to or cost of voting, electoral policies that increase the integrity of elections and observed democratic outcomes. We stratified the COVI into tertiles for analyses capturing more or fewer structural barriers.
- Libraries: Data on library use come from the Public Libraries Survey for 2020 conducted by the Institute of Museum and Library Services. The analytic dataset was delimited by excluding library outlets that were privately owned, open less than 80 hours in 2020 or were designated “Books-by-Mail Only” locations (in total less than 2% of libraries). Visits per capita was derived by splitting the number of annual visits assigned to a library system’s administrative entity evenly between its outlets. These visits per outlet were then summed by county and divided by the county population. Note: the impact of the COVID-19 pandemic in 2020 likely affected library operating hours and use.
- Newspapers: Data on the availability of local newspapers for 2020 were provided upon request by the University of North Carolina at Chapel Hill Hussman School of Journalism and Media. Details about their methodology can be found here.
- Volunteering: Data on volunteering at the state level come from the 2021 Current Population Survey Civic Engagement and Volunteering Supplement conducted by the U.S. Census Bureau and AmeriCorps.
- Access to Adequately Funded Schools: The percent of counties that receive funding at or above the estimated amount of per-pupil spending required to achieve national average test scores. School funding adequacy is calculated for each public school district. The county value is the cross-district average of funding adequacy. Formulas allocating education spending vary by state and by school districts within states. Determining the formulas and providing the majority of the funding is within the purview of state and local governments.
Suggested Reading
Find relevant research and evidence for key topics and their connection to the 2023 National Findings Report.
Download Maps & Figures
Land acknowledgement
The University of Wisconsin Population Health Institute occupies Ho-Chunk land, a place their nation has called Teejop (Day-JOPE) since time immemorial. In 1832, the Ho-Chunk were forced to surrender this territory. Decades of genocide followed when both the federal and state government repeatedly, but unsuccessfully, sought to forcibly remove the Ho-Chunk people from Wisconsin. This history of colonization informs our shared future of building partnership that prioritize respect and meaningful engagement. The staff of the institute respects the inherent sovereignty of the Ho-Chunk National, along with the eleven other First Nations of Wisconsin. We operationalize our values by considering the many legacies of violence, erasure, displacement, migration, and settlement. We carry these truths as we work to make positive change.
Credits
Recommended citation
University of Wisconsin Population Health Institute, County Health Rankings & Roadmaps. National Findings Report 2024. www.countyhealthrankings.org
Support for this work was provided by the Robert Wood Johnson Foundation. The views expressed here do not necessarily reflect the views of the Foundation.
Thank you to our reviewers from the University of Wisconsin Population Health Institute: Salma Abadin, MPH; Wajiha Akhtar, PhD; and Alisa Pykett, PhD.
We thank the data stewards and providers at the Northern Illinois University Cost of Voting Index; Massachusetts Institute of Technology Election Lab; the Centers for Disease Control and Prevention Places; the National Center for Health Statistics; and the United States Census Bureau for their consultation and data collection.
We are grateful for all the people who are our village and make civic health possible.
Lead Authors
Elizabeth Blomberg, PhD
Keith Gennuso, PhD
Kim Gilhuly, MPH
Marjory Givens, PhD, MSPH
Sheri Johnson, PhD
Christine Muganda, PhD
Bethany Rogerson, MS
Michael Stevenson, MPH
This publication would not have been possible without the following contributions. Contributors are listed in alphabetical order:
Research & Analysis
Katherine Barnes, MS, MPH, CPH
Molly Burdine, MS
Ben Case, MPH
Kiersten Frobom, MPA, MPH
Gillian Giglierano, MPA
Lael Grigg, MPA
Bomi Kim Hirsch, PhD
Jess Hoffelder, MPH
Ksenia Kostelanetz
Ganhua Lu, MS, PhD
Heriberto Martir
Suryadewi Nugraheni, MD, MA, PhD
Hannah Olson-Williams
Naiya Patel, MPA, MPH
Jennifer Robinson
Jessica Rubenstein, MPA, MPH
Nicholas Schmuhl, PhD
Jessica Solcz, MPH
Outreach & Communications
Beth Silver, MCM
Colleen Wick, MA
Narrative infrastructure
Angela Acker, MPH, CPH
Jed Amurao, MPH
Ericka Burroughs-Girardi, MA, MPH
Jonathan Heller, PhD
Website & Dissemination
Lindsay Garber, MPA
Everett Trechter, MPP
Molly Neumeyer, MS
Program Operations
Tricia Ballweg
James Lloyd, MS
Plumer Lovelace III
Erin Schulten, MPH, MBA
Cathy Vos
Scientific Advisory Group
David Chae, ScD, MA
Tracy A. Corley, PhD
Tom Eckstein, MBA
Kurt Greenlund, PhD
Ryan Petteway, DrPH, MPH
Pat Remington, MD, MPH
Steven Teutsch, MD, MPH
Communication Support
Burness
Website Support
Forum One


