Explore a new national map of health
Clean air and water, access to good paying jobs and the chance to have a say in your community. These are all community conditions that influence your health. At County Health Rankings & Roadmaps (CHR&R), we provide a snapshot of health-related measures for nearly every county in the U.S. And we know that what influences health isn’t neatly contained within a county or state border. We now have updated methods and a new national map, which offer a broad view of regional and national trends and invite actions to improve health for all.
In 2024, we revised our methods and introduced Health Groups, which provide data-informed groupings on a national continuum. Each county (where data are available) is assigned to one of ten Health Groups with a corresponding color shade. Building upon our previous ranking approach that supported comparisons between counties within states, the new approach allows users to identify counties in the same Health Group or color shade in any state across the nation. (View downloadable data from CHR&R’s 2025 Annual Data Release to find county Health Group numbers.)
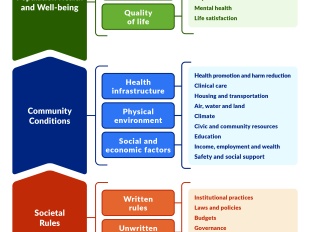
These updated methods make it possible to add a new website feature to all state pages. Users can now view a national map of county Health Groups and see regional patterns. We know regions such as the Black Belt, Appalachia, American Indian/Alaska Native Tribal areas and counties along the U.S.-Mexico border have less access to the community conditions needed for good health. Where types of long-standing discrimination and disinvestment have occurred through policies and practices — such as racial segregation through redlining, legal actions to terminate tribal culture and land rights, and disinvestment in rural economies — counties fall among the least healthy in measures of community conditions. The new Health Groups national map shows these patterns of Community Conditions and the impact on Population Health and Well-being and can support communities to build power for health and equity.
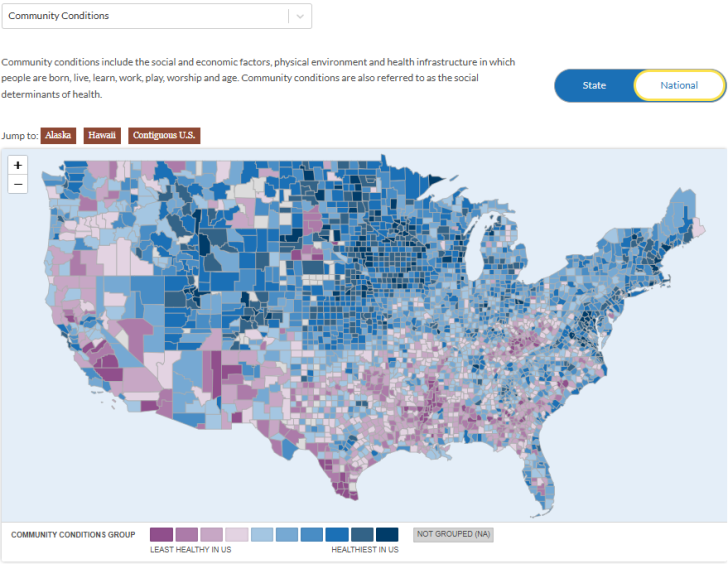
To explore the national map, start by searching for a state. From the state page, use the toggle to switch from the state map to the new national view. Users can view Population Health and Well-being or Community Conditions, based on a selection from the drop-down menu. The map is interactive, allowing users to click to zoom in for more county-specific data or area of interest. Start your exploration by searching for your state here.
Population Health and Well-being National Map

Community Conditions National Map